Pet spending in America: what owners pay by category, and how prices changed
In 2024, average spending on pets was $880 Surveyed[1] per BLS consumer unit (roughly a household), a figure that includes units with no pets.
$880
average yearly spending on pets per BLS consumer unit
Household survey mean across all consumer units, including those with no pets; not an average per pet owner.
Source: BLS [1]
47.0%
rise in veterinarian prices, 2019 to 2025 annual averages
A price index (CPI-U, US city average), not spending. All items rose 25.9% Counted[2] over the same years.
Calculated from BLS [2]
$158 billion
US pet industry sales (APPA estimate)
An industry sales estimate, not household spending; it is built differently from the BLS figure and not comparable with it.
Source: APPA [3]
Three separate measures: household spending from the BLS Consumer Expenditure Survey, price changes from the BLS Consumer Price Index (annual averages, not seasonally adjusted), and industry sales from APPA’s estimate.
Published Last reviewed Next scheduled review
In short
Key takeaways
- Average spending on pets was $880 Surveyed[1] per BLS consumer unit in 2024, including units with no pets, up from $480 Surveyed[1] in 2010 before inflation.
- After inflation, average pet spending rose 25.9% Surveyed[1] between 2015 and 2024.
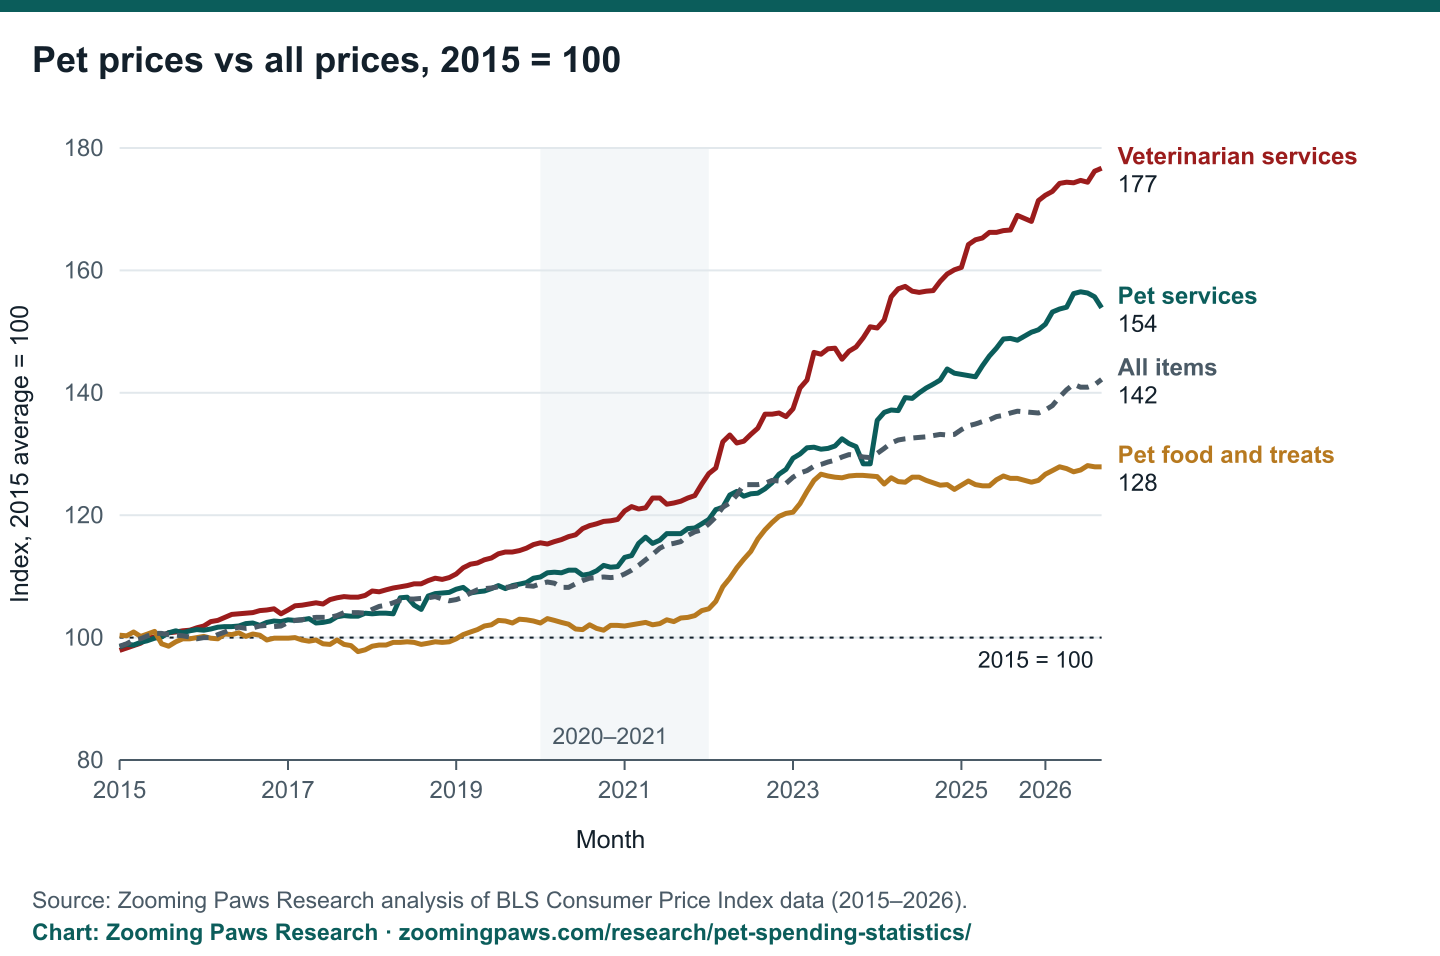
- Vet prices rose 47.0% Counted[2] from 2019 to 2025; pet services rose 35.4% Counted[2] and pet food 23.1% Counted[2], against 25.9% Counted[2] for all prices.
- Vet services were 35% Surveyed[1] of household pet spending, the largest single category in 2024.
- The highest-income fifth of households spent 5.1 Surveyed[1] times what the lowest-income fifth spent on pets.
- APPA estimates industry sales of $158 billion Estimated[3] in 2025, an industry figure built differently from the household survey.
Explore the data
Pet inflation calculator
Pick a category and the month you paid. The calculator uses the matching BLS price index, month to month, the way the BLS CPI Inflation Calculator does, and shows the series it used.
Pet inflation calculator
What an amount spent on pets in an earlier month would cost in September 2026, the latest month BLS has published.
Same pet services in September 2026
$142.65
$100.00 in January 2019 · prices up 42.6%
Counted BLS CPI-U series CUUR0000SS62053, index 195.373 → 278.694. Calculation: $100.00 × 278.694 ÷ 195.373.
Household pet spending by income group, 2024
Average yearly spending per household in each fifth of the income distribution, from the BLS Consumer Expenditure Survey.
- All pet spending
- $368
- Pet food
- $164
- Pet purchase, supplies, and medicine
- $71
- Pet services
- $19
- Vet services
- $114
Surveyed Mean across all households in the group, including those with no pets. Some quintile figures carry a BLS reliability warning; see the full table and limitations below.
Charts
The data in charts
Every chart can be downloaded as a PNG or as the CSV behind it, and embedded with a credit link.
Pet prices vs all prices, 2015 = 100
CPI-U, U.S. city average, not seasonally adjusted. Each series is divided by its own 2015 annual average, so the lines show price change since 2015, not price levels. Shaded: 2020 and 2021. BLS published no October 2025 values (federal funding lapse), so the lines join September to November there.
Source: Zooming Paws Research analysis of BLS Consumer Price Index data (2015–2026).
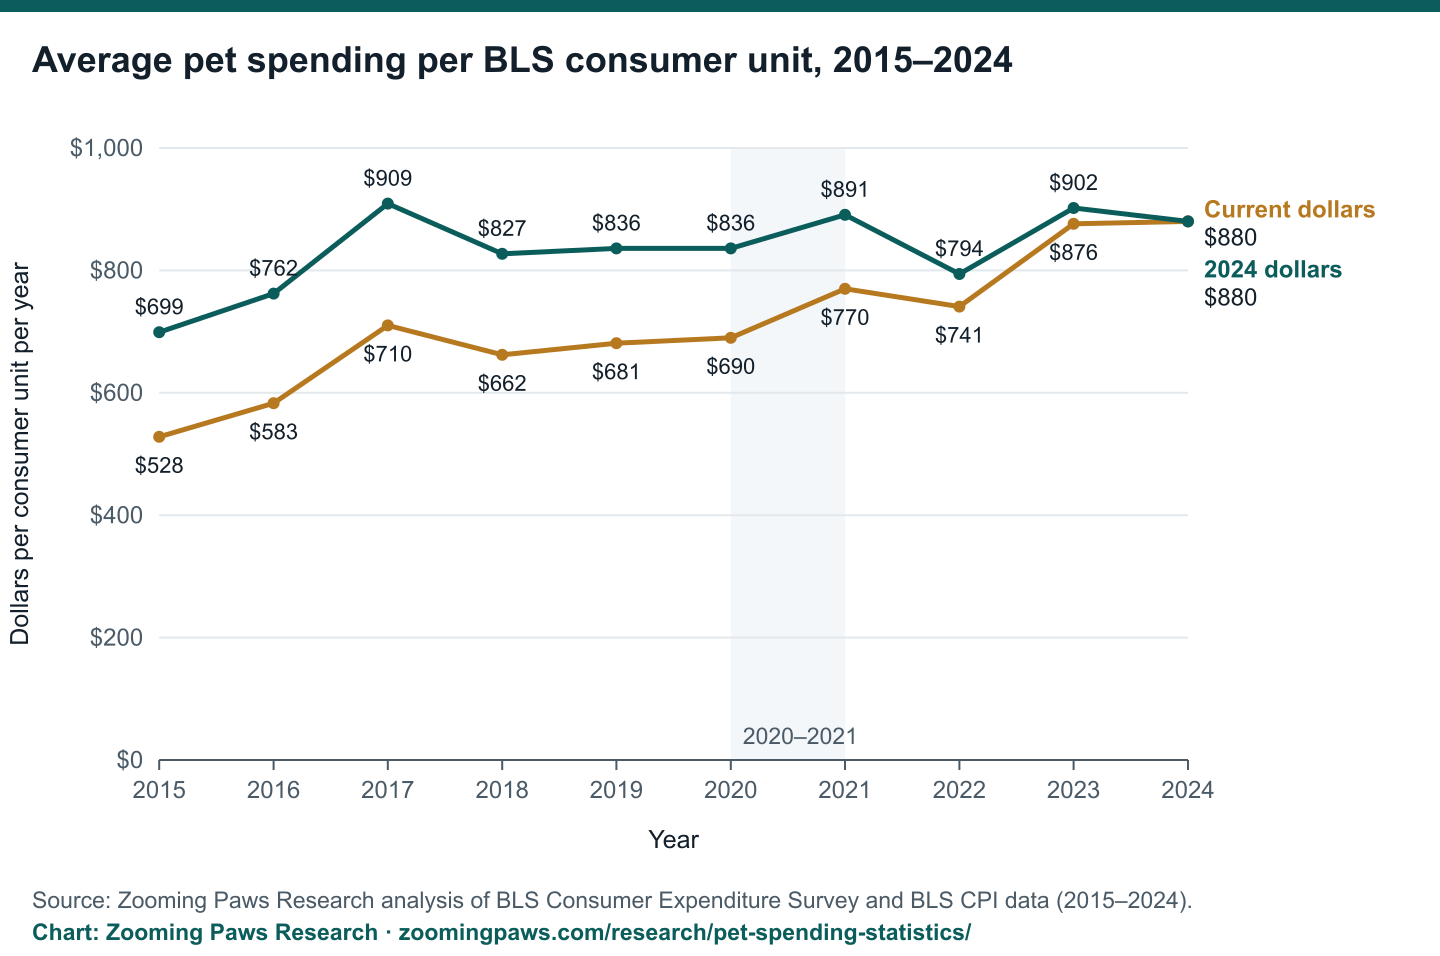
Average pet spending per BLS consumer unit, 2015–2024
Mean across all consumer units, including those with no pets. 2024 dollars use the CPI-U all items annual average. Shaded: 2020 and 2021.
Source: Zooming Paws Research analysis of BLS Consumer Expenditure Survey and BLS CPI data (2015–2024).
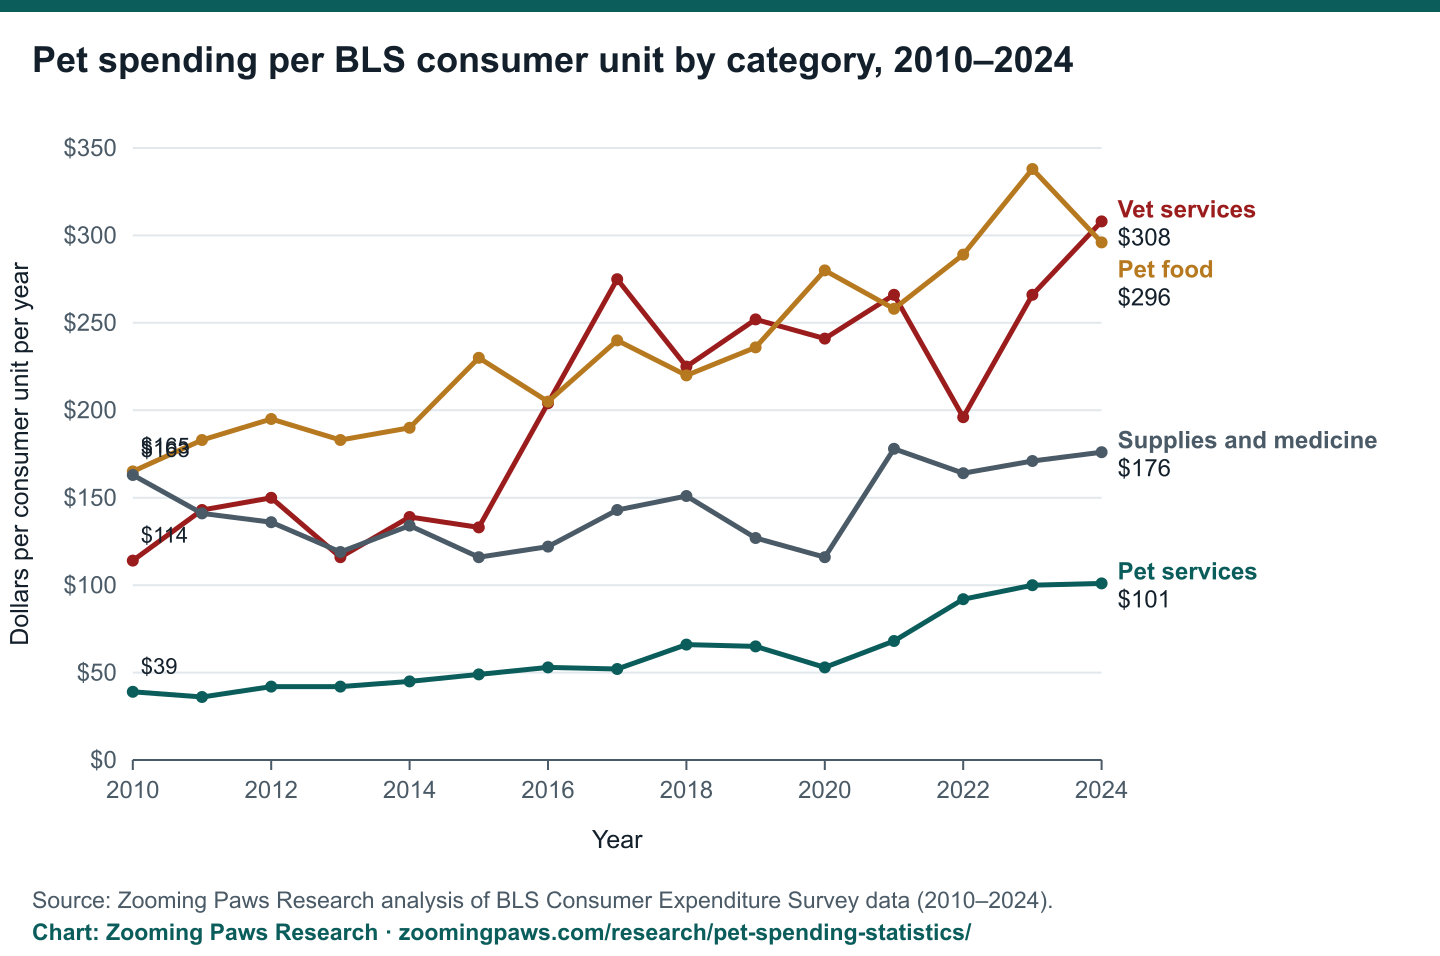
Pet spending per BLS consumer unit by category, 2010–2024
Current dollars, mean across all consumer units. "Pet services" covers grooming, boarding, training and other non-veterinary services.
Source: Zooming Paws Research analysis of BLS Consumer Expenditure Survey data (2010–2024).
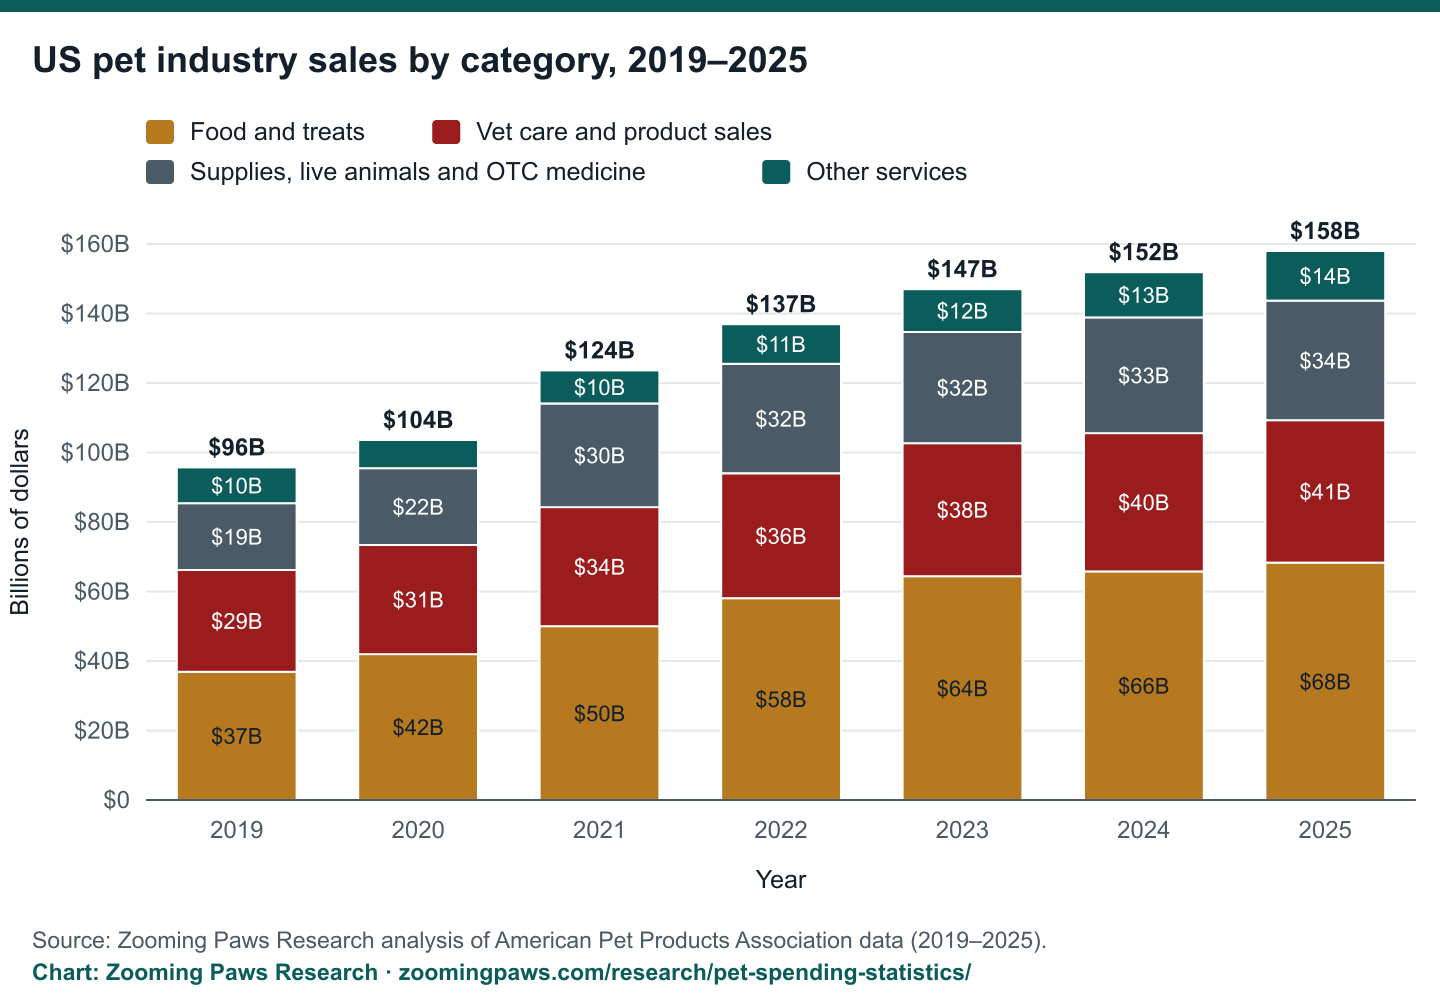
US pet industry sales by category, 2019–2025
APPA estimates (supply-side industry sales), current dollars, as shown on APPA’s public statistics page. APPA revises earlier years between releases; column totals are the sum of the four categories and can differ from APPA’s headline total.
Source: Zooming Paws Research analysis of American Pet Products Association data (2019–2025).
How much do households spend on pets?
In 2024 the average US consumer unit spent $880 Surveyed[1] on pets. By category that was $308 Surveyed[1] on vet services, $296 Surveyed[1] on pet food, $176 Surveyed[1] on buying pets, supplies and medicine, and $101 Surveyed[1] on pet services such as grooming and boarding.
These are means across every consumer unit, including the many with no pet, so pet-owning households spend more than this on average. BLS does not publish a pet-owners-only average. BLS rounds each category to the dollar separately, so the four categories may not add exactly to the rounded total.
Which pet costs rose fastest?
Comparing 2019 and 2025 annual average prices (CPI-U, US city average, not seasonally adjusted): veterinarian services rose 47.0% Counted[2], pet services 35.4% Counted[2], pet food and treats 23.1% Counted[2], and the whole pets, pet products and services group 28.4% Counted[2]. All items rose 25.9% Counted[2].
A note on grooming
BLS publishes no grooming-only price index among its pet series. Grooming is priced within pet services, which BLS describes as grooming, boarding and training. For what a groom costs today by size and coat, use our grooming cost estimator or the groomer tip calculator.
Pet prices and spending before and after 2020
The price chart above shades 2020 and 2021. The pet food and pet supplies indexes barely moved from 2015 through 2021, then climbed sharply in 2022 and 2023. The vet index was already rising faster than prices overall before 2020 and kept pulling away after it.
On the spending side, the household figure went from $699 Surveyed[1][2] in 2015 (in 2024 dollars) to $880 Surveyed[1] in 2024. The household survey cannot say how much of that is more pets and how much is more spent per pet.
Industry totals vs household spending: why they differ
APPA’s $158 billion Estimated[3] for 2025 is a supply-side estimate of sales, built from retail scanner data, market research and industry validation. The BLS figure comes from households reporting what they spent.
The two count different things. APPA’s categories mix product sales into vet care and include live animals and over-the-counter medicine with supplies. BLS counts consumer units, not pet owners, and its survey is designed to measure household budgets rather than an industry. Neither source publishes a reconciliation, so do not divide one by the other.
APPA also revises earlier years between releases and changed its method for 2018, so its older totals are not comparable with the current series.
Pet spending by region
The Consumer Expenditure Survey publishes pet spending for the four Census regions. In 2024 the average was $1,151 Surveyed[1] in the West, $837 Surveyed[1] in the Midwest, $836 Surveyed[1] in the South and $685 Surveyed[1] in the Northeast.
BLS does not publish pet spending by state, so there is no state table on this page.
Data
Household pet spending by category and year
Every BLS Consumer Expenditure figure we use, with its series ID and a real-dollar column where our CPI data reaches.
| 2024 | Pets | $880 | $880 | CXUPETSLB0101M | Surveyed |
| 2024 | Pet food | $296 | $296 | CXU610310LB0101M | Surveyed |
| 2024 | Pet purchase, supplies, and medicine | $176 | $176 | CXU610320LB0101M | Surveyed |
| 2024 | Pet services | $101 | $101 | CXU620410LB0101M | Surveyed |
| 2024 | Vet services | $308 | $308 | CXU620420LB0101M | Surveyed |
| 2023 | Pets | $876 | $902 | CXUPETSLB0101M | Surveyed |
| 2023 | Pet food | $338 | $348 | CXU610310LB0101M | Surveyed |
| 2023 | Pet purchase, supplies, and medicine | $171 | $176 | CXU610320LB0101M | Surveyed |
| 2023 | Pet services | $100 | $103 | CXU620410LB0101M | Surveyed |
| 2023 | Vet services | $266 | $274 | CXU620420LB0101M | Surveyed |
| 2022 | Pets | $741 | $794 | CXUPETSLB0101M | Surveyed |
| 2022 | Pet food | $289 | $310 | CXU610310LB0101M | Surveyed |
| 2022 | Pet purchase, supplies, and medicine | $164 | $176 | CXU610320LB0101M | Surveyed |
| 2022 | Pet services | $92 | $99 | CXU620410LB0101M | Surveyed |
| 2022 | Vet services | $196 | $210 | CXU620420LB0101M | Surveyed |
| 2021 | Pets | $770 | $891 | CXUPETSLB0101M | Surveyed |
| 2021 | Pet food | $258 | $299 | CXU610310LB0101M | Surveyed |
| 2021 | Pet purchase, supplies, and medicine | $178 | $206 | CXU610320LB0101M | Surveyed |
| 2021 | Pet services | $68 | $79 | CXU620410LB0101M | Surveyed |
| 2021 | Vet services | $266 | $308 | CXU620420LB0101M | Surveyed |
| 2020 | Pets | $690 | $836 | CXUPETSLB0101M | Surveyed |
| 2020 | Pet food | $280 | $339 | CXU610310LB0101M | Surveyed |
| 2020 | Pet purchase, supplies, and medicine | $116 | $141 | CXU610320LB0101M | Surveyed |
| 2020 | Pet services | $53 | $64 | CXU620410LB0101M | Surveyed |
| 2020 | Vet services | $241 | $292 | CXU620420LB0101M | Surveyed |
| 2019 | Pets | $681 | $836 | CXUPETSLB0101M | Surveyed |
| 2019 | Pet food | $236 | $290 | CXU610310LB0101M | Surveyed |
| 2019 | Pet purchase, supplies, and medicine | $127 | $156 | CXU610320LB0101M | Surveyed |
| 2019 | Pet services | $65 | $80 | CXU620410LB0101M | Surveyed |
| 2019 | Vet services | $252 | $309 | CXU620420LB0101M | Surveyed |
| 2018 | Pets | $662 | $827 | CXUPETSLB0101M | Surveyed |
| 2018 | Pet food | $220 | $275 | CXU610310LB0101M | Surveyed |
| 2018 | Pet purchase, supplies, and medicine | $151 | $189 | CXU610320LB0101M | Surveyed |
| 2018 | Pet services | $66 | $82 | CXU620410LB0101M | Surveyed |
| 2018 | Vet services | $225 | $281 | CXU620420LB0101M | Surveyed |
| 2017 | Pets | $710 | $909 | CXUPETSLB0101M | Surveyed |
| 2017 | Pet food | $240 | $307 | CXU610310LB0101M | Surveyed |
| 2017 | Pet purchase, supplies, and medicine | $143 | $183 | CXU610320LB0101M | Surveyed |
| 2017 | Pet services | $52 | $67 | CXU620410LB0101M | Surveyed |
| 2017 | Vet services | $275 | $352 | CXU620420LB0101M | Surveyed |
| 2016 | Pets | $583 | $762 | CXUPETSLB0101M | Surveyed |
| 2016 | Pet food | $205 | $268 | CXU610310LB0101M | Surveyed |
| 2016 | Pet purchase, supplies, and medicine | $122 | $159 | CXU610320LB0101M | Surveyed |
| 2016 | Pet services | $53 | $69 | CXU620410LB0101M | Surveyed |
| 2016 | Vet services | $204 | $267 | CXU620420LB0101M | Surveyed |
| 2015 | Pets | $528 | $699 | CXUPETSLB0101M | Surveyed |
| 2015 | Pet food | $230 | $304 | CXU610310LB0101M | Surveyed |
| 2015 | Pet purchase, supplies, and medicine | $116 | $154 | CXU610320LB0101M | Surveyed |
| 2015 | Pet services | $49 | $65 | CXU620410LB0101M | Surveyed |
| 2015 | Vet services | $133 | $176 | CXU620420LB0101M | Surveyed |
| 2014 | Pets | $507 | No data | CXUPETSLB0101M | Surveyed |
| 2014 | Pet food | $190 | No data | CXU610310LB0101M | Surveyed |
| 2014 | Pet purchase, supplies, and medicine | $134 | No data | CXU610320LB0101M | Surveyed |
| 2014 | Pet services | $45 | No data | CXU620410LB0101M | Surveyed |
| 2014 | Vet services | $139 | No data | CXU620420LB0101M | Surveyed |
| 2013 | Pets | $460 | No data | CXUPETSLB0101M | Surveyed |
| 2013 | Pet food | $183 | No data | CXU610310LB0101M | Surveyed |
| 2013 | Pet purchase, supplies, and medicine | $119 | No data | CXU610320LB0101M | Surveyed |
| 2013 | Pet services | $42 | No data | CXU620410LB0101M | Surveyed |
| 2013 | Vet services | $116 | No data | CXU620420LB0101M | Surveyed |
| 2012 | Pets | $522 | No data | CXUPETSLB0101M | Surveyed |
| 2012 | Pet food | $195 | No data | CXU610310LB0101M | Surveyed |
| 2012 | Pet purchase, supplies, and medicine | $136 | No data | CXU610320LB0101M | Surveyed |
| 2012 | Pet services | $42 | No data | CXU620410LB0101M | Surveyed |
| 2012 | Vet services | $150 | No data | CXU620420LB0101M | Surveyed |
| 2011 | Pets | $502 | No data | CXUPETSLB0101M | Surveyed |
| 2011 | Pet food | $183 | No data | CXU610310LB0101M | Surveyed |
| 2011 | Pet purchase, supplies, and medicine | $141 | No data | CXU610320LB0101M | Surveyed |
| 2011 | Pet services | $36 | No data | CXU620410LB0101M | Surveyed |
| 2011 | Vet services | $143 | No data | CXU620420LB0101M | Surveyed |
| 2010 | Pets | $480 | No data | CXUPETSLB0101M | Surveyed |
| 2010 | Pet food | $165 | No data | CXU610310LB0101M | Surveyed |
| 2010 | Pet purchase, supplies, and medicine | $163 | No data | CXU610320LB0101M | Surveyed |
| 2010 | Pet services | $39 | No data | CXU620410LB0101M | Surveyed |
| 2010 | Vet services | $114 | No data | CXU620420LB0101M | Surveyed |
Select a column heading to sort by it.
Method
How we built this
Data sources
Household spending: BLS Consumer Expenditure Survey annual means for all consumer units, income quintiles and Census regions, downloaded from the BLS public data API. Prices: CPI-U U.S. city average, not seasonally adjusted, monthly values from the same API and annual averages from the BLS Data Viewer. Industry totals: APPA’s public statistics page and press releases; we did not use its paid report.
Calculations you can reproduce
Price change between two years is the later annual average divided by the earlier one, minus one. Real dollars multiply a year’s spending by the all-items annual average of the target year and divide by that of the spending year. The calculator multiplies the amount by the index in the latest month and divides by the index in the month you chose.
We checked the calculator against the BLS CPI Inflation Calculator on two dates. BLS returned $133.86 Counted[2] for 2019-01 to 2026-09 and $135.93 Counted[2] for 2015-01 to 2025-01, both for a hundred dollars; our all-items calculation gives the same to the cent.
Definitions
A consumer unit is roughly a household: people living together who share major expenses. Pet services cover grooming, boarding and training. Vet services are veterinary care. The CPI series have different base periods, so the chart compares them by indexing each to its own average for the first year.
Downloads: the full household table and the CSV under each chart.
Limits
What this data cannot tell you
- BLS household spending is a mean over all households, including those without pets. There is no pet-owner average and no figure per pet.
- Our CE data starts in 2010 (the API returned nothing earlier for these series) and ends in 2024; the next year is not yet released. Real dollars start in 2015, the first year of our CPI file.
- Some income-quintile and regional figures carry a BLS warning that the relative standard error is at least a quarter of the estimate. The warning is kept in the notes column of the CSV.
- BLS gives the CE sample as respondents per quarter rather than one annual sample size: BLS reports it in its data quality report, quoted in the hover text of each household figure.
- BLS published no October 2025 CPI values because of the federal funding lapse; the calculator says so if you pick that month.
- APPA does not publish ranges, sample sizes or a full method, revises past years, and changed method part-way through its series. Its figures are labelled estimated, and its terms restrict linking, so its address is shown as text.
- There is no state-level pet spending from BLS, and we found no other official state series.
Press kit
For journalists and bloggers
Copy any line below. Each copied line carries the status, publisher and year of every figure in it, so it stays accurate on its own. Please credit and link this page. Suggested credit line: Source: Zooming Paws Research analysis of BLS and APPA data (2024–2025)
- Average spending on pets was $880 Surveyed[1] per US consumer unit in 2024, including units with no pets, according to the BLS Consumer Expenditure Survey.
- US veterinarian prices rose 47.0% Counted[2] between the 2019 and 2025 annual averages, against 25.9% Counted[2] for all consumer prices (BLS CPI-U, US city average).
- Vet services were 35% Surveyed[1] of average spending on pets per US consumer unit in 2024, a Zooming Paws Research calculation from BLS Consumer Expenditure Survey data.
- In 2024, the highest-income fifth of US consumer units spent 5.1 Surveyed[1] times as much on pets as the lowest-income fifth, a Zooming Paws Research calculation from BLS Consumer Expenditure Survey data.
- APPA estimates US pet industry sales at $158 billion Estimated[3] in 2025; this is an industry sales estimate, not household spending.
Cite this page
Zooming Paws Research. (2026). Pet spending in America: what owners pay by category, and how prices changed. Zooming Paws. Retrieved October 27, 2026, from https://zoomingpaws.com/research/pet-spending-statistics/
Downloads
FAQ
Questions people ask
- How much does the average household spend on pets per year?
- Average spending on pets was $880 Surveyed[1] per BLS consumer unit (roughly a household) in 2024, according to the BLS Consumer Expenditure Survey. That average includes units with no pets, so pet owners spend more than this on average. Vet services were $308 Surveyed[1] and pet food $296 Surveyed[1].
- How much do Americans spend on pets in total each year?
- The American Pet Products Association estimates US pet industry sales at $158 billion Estimated[3] in 2025, and projects $165 billion Estimated[3] for 2026. That is an industry sales estimate, not a count, and it covers more than household spending, so it is not comparable with the BLS household figure.
- How much have vet prices gone up?
- The CPI for veterinarian services rose 47.0% Counted[2] from the 2019 annual average to the 2025 average, against 25.9% Counted[2] for all items. Since 2015 the vet index is up 66.3% Counted[2], compared with 35.8% Counted[2] for prices overall.
- Is pet food more expensive than before the pandemic?
- Yes. The CPI for pet food and treats rose 23.1% Counted[2] between the 2019 and 2025 annual averages. That is a little less than the vet and pet services indexes, which rose 47.0% Counted[2] and 35.4% Counted[2] over the same years.
- What share of pet spending goes to the vet?
- In the BLS household survey, vet services were 35% Surveyed[1] of average household pet spending in 2024: $308 Surveyed[1] out of $880 Surveyed[1]. In APPA’s industry estimate, vet care and product sales were $41.0 billion Estimated[3] of $158 billion Estimated[3].
- Do higher-income households spend more on pets?
- Yes, by a wide margin. In 2024 the highest-income fifth of households spent $1,861 Surveyed[1] on pets on average and the lowest-income fifth $368 Surveyed[1], a ratio of 5.1 Surveyed[1] to one. Part of the gap is that fewer lower-income households own pets, which the survey does not separate out.
- Which region spends the most on pets?
- The West. Average household pet spending in 2024 was $1,151 Surveyed[1] in the West, $837 Surveyed[1] in the Midwest, $836 Surveyed[1] in the South and $685 Surveyed[1] in the Northeast. BLS publishes these for the four Census regions only, not by state.
- Has pet spending outpaced inflation?
- Yes. Average household pet spending went from $699 Surveyed[1][2] in 2015 (in 2024 dollars) to $880 Surveyed[1] in 2024, a real increase of 25.9% Surveyed[1]. Before adjusting for inflation the rise was 66.7% Surveyed[1].
- Does the CPI track dog grooming prices?
- Not on its own. BLS publishes no grooming-only index among its pet series; grooming is priced within pet services, which BLS describes as grooming, boarding and training. That index rose 35.4% Counted[2] between the 2019 and 2025 annual averages.
Keep going
Related calculators and research
Grooming cost estimator
A price range by size, coat and service.
OpenGroomer tip calculator
A fair tip for salon, mobile and holiday visits.
OpenShelter statistics
Intake, adoptions and euthanasia, and how the main sources differ.
OpenHow many puppies are born each year?
What is counted, surveyed and modelled, with a transparent estimate.
OpenPet statistics and research
Sourced, labelled pet statistics with downloadable data.
OpenSources
Sources
[1] Consumer Expenditure Surveys: average annual expenditures per consumer unit on Pets, Pet food, Pet purchase/supplies/medicine, Pet services, Vet services (all consumer units, income quintiles, Census regions)
U.S. Bureau of Labor Statistics · retrieved October 27, 2026 · next review December 31, 2026
Terms: U.S. federal government data, public domain (standard status; no BLS terms page saved because www.bls.gov returns 403 to curl).
https://www.bls.gov/cex/[2] Consumer Price Index for All Urban Consumers (CPI-U), U.S. city average, not seasonally adjusted: All items and pet item series; CPI Inflation Calculator
U.S. Bureau of Labor Statistics · retrieved October 27, 2026 · next review November 20, 2026
Terms: U.S. federal government data, public domain (standard status; no BLS terms page saved because www.bls.gov returns 403 to curl).
https://www.bls.gov/cpi/[3] Industry Trends and Stats: Total U.S. Pet Industry Expenditures (current page, press releases, and archived vintages of APPA's public stats page)
American Pet Products Association (APPA) · retrieved October 27, 2026 · next review March 31, 2027
Terms: APPA terms: "Any copying, republication, or linking of these materials, electronically or otherwise, is expressly prohibited without APPA's or the rightful copyright holder's prior written approval." APPA also says it "makes the industry statistics available publicly on an annual basis". Use the figures as attributed facts only; do not reproduce APPA text or charts. Only public figures were used, not the paid report.
https://americanpetproducts.org/industry-trends-and-stats (not linked: the publisher's terms restrict linking)
Figures are compiled from the named sources for information. Definitions vary by publisher, so check a source’s own definitions before comparing its figures with another’s. Not for legal or regulatory use. Attribution: Zooming Paws Research.