Shelter dogs and cats by the numbers: intake, adoptions and euthanasia
Shelter Animals Count estimates that 5.79 million Estimated[1] dogs and cats entered US shelters and rescues in 2025, 4.22 million Estimated[1] were adopted and 597,000 Estimated[1] were euthanised.
5.79 million
dogs and cats entering shelters and rescues, excluding transfers
A model estimate for all known shelters and rescues, not a full count.
Source: Shelter Animals Count [1]
4.22 million
dogs and cats adopted
Same model estimate; adoptions only, not other live outcomes.
Source: Shelter Animals Count [1]
597,000
dogs and cats euthanised in shelters (our sum of SAC’s dog and cat figures)
Shelter euthanasia only. Best Friends’ “killed” figure is a different measure and is not interchangeable.
Calculated from Shelter Animals Count [1]
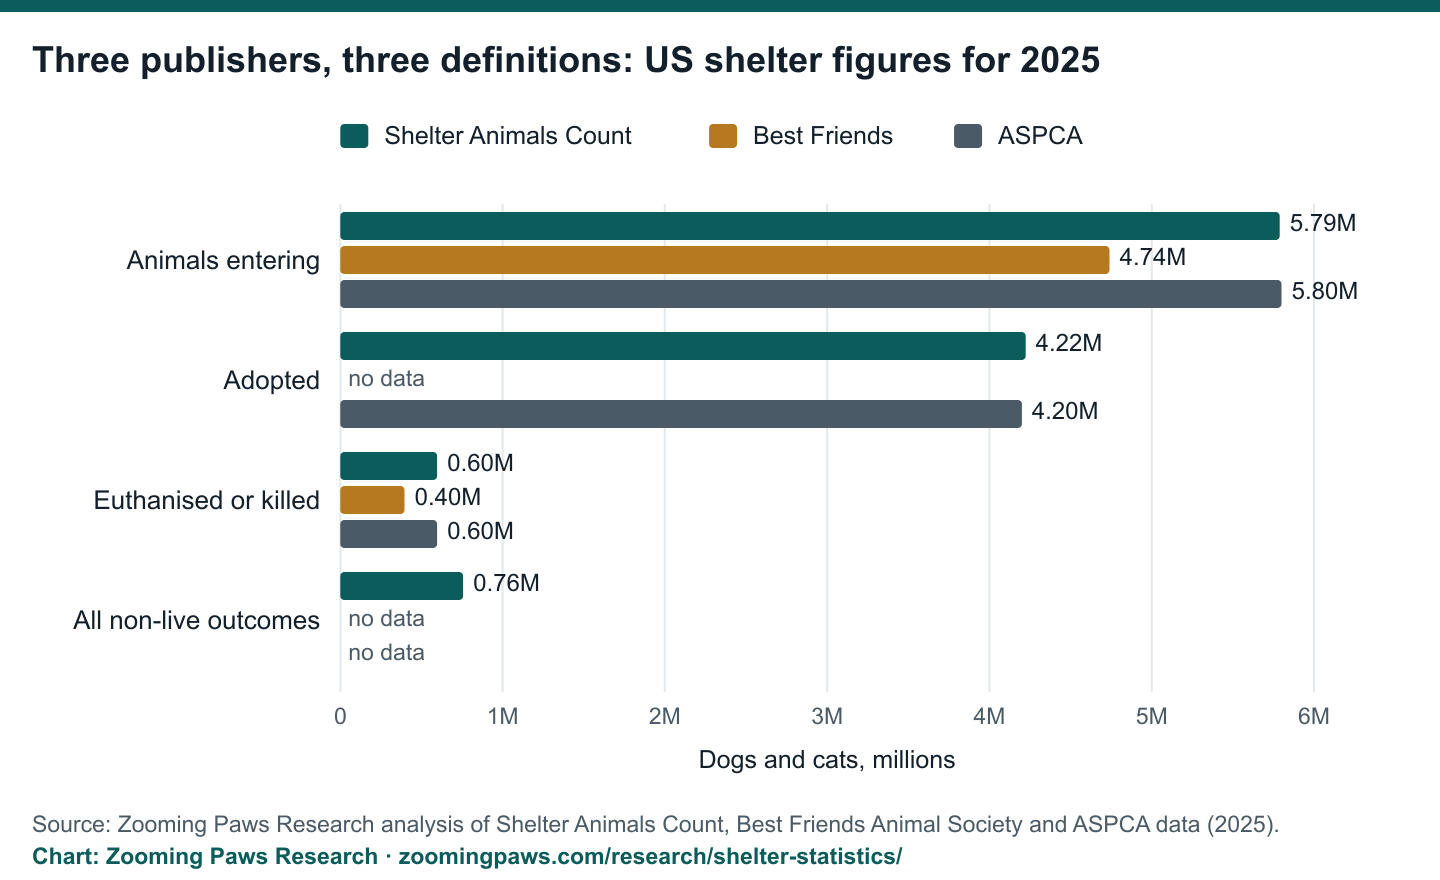
How the sources differ: Best Friends Animal Society counts brick-and-mortar shelters only and reports a 82.5% Estimated[2] national save rate under its own definition, with a “killed” measure that subtracts an allowance for humane euthanasia. The ASPCA republishes Shelter Animals Count’s figures, so it is not an independent confirmation.
Published Last reviewed Next scheduled review
In short
Key takeaways
- Shelters and rescues took in 2.83 million Estimated[1] dogs and 2.96 million Estimated[1] cats in 2025, not counting transfers.
- 4.22 million Estimated[1] dogs and cats were adopted and 638,000 Estimated[1] returned to their owners.
- 320,000 Estimated[1] dogs and 277,000 Estimated[1] cats were euthanised; dog euthanasia fell 6.8% Estimated[1] on the year before.
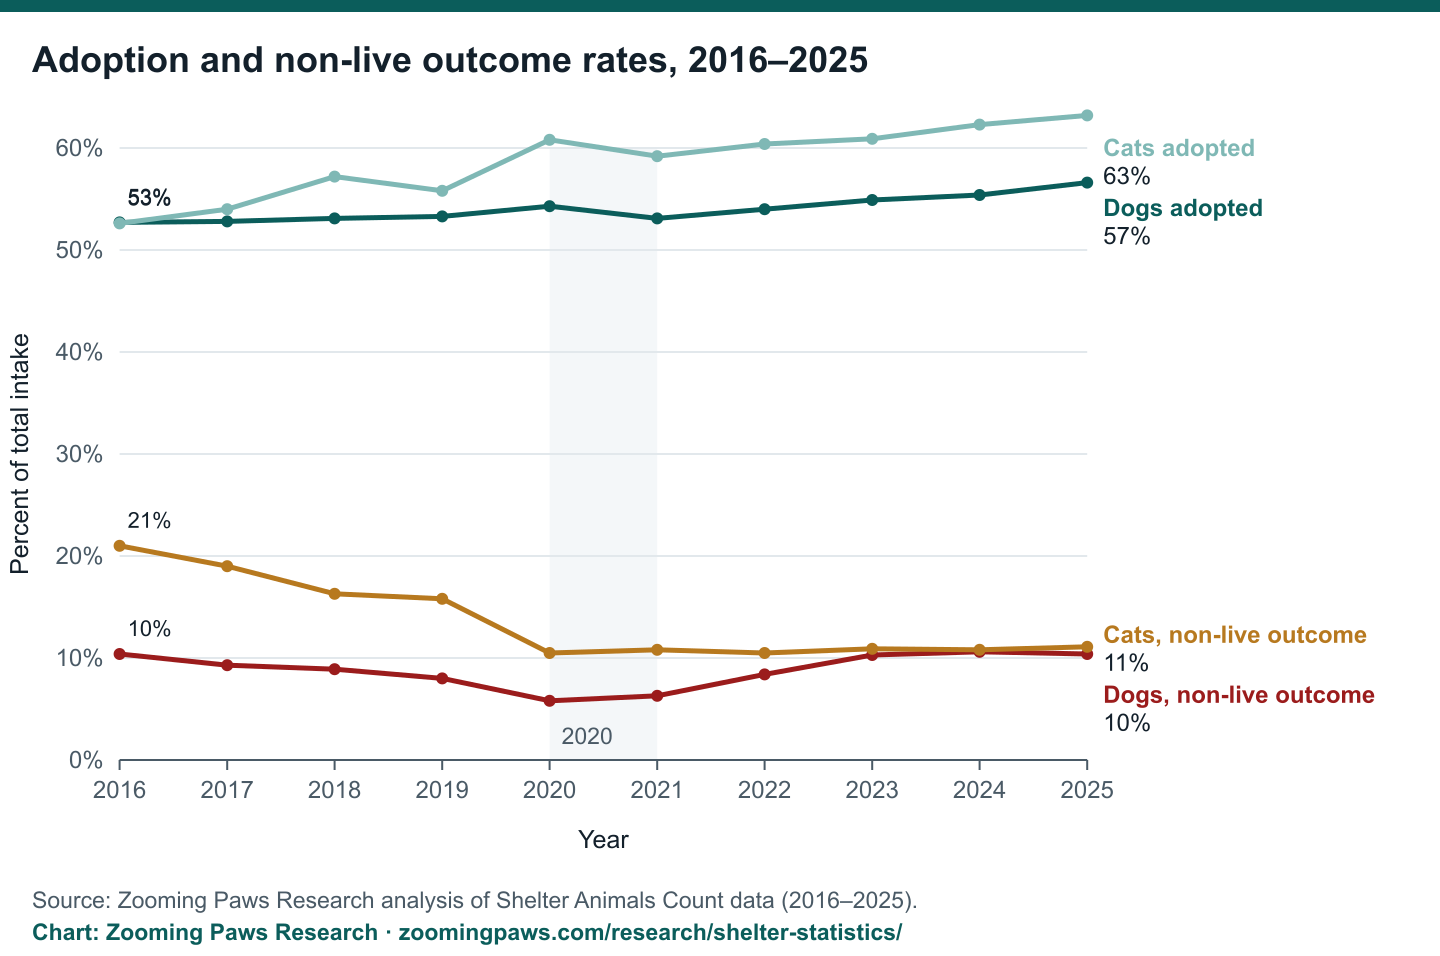
- The cat non-live outcome rate has nearly halved since 2016, from 21.0% Estimated[1] to 11.1% Estimated[1] of intake; the dog rate is back to 10.4% Estimated[1] after a low of 8.0% Estimated[1] in 2019.
- Best Friends puts the national save rate, under its own definition, at 82.5% Estimated[2], up from 71% Estimated[2] in 2016.
- Shelter Animals Count’s intake figure is 1.05 million Estimated[1][2] higher than Best Friends’, because the two count different organisations.
Explore the data
Compare the sources
Pick a measure to see what each publisher reports for the same year, how it defines it, and the rate per thousand US residents. State figures are not yet available; see the limitations below.
Compare the sources
Pick a measure and an animal to see each publisher’s national figure and how it is defined.
Shelter Animals Count
5,789,000
EstimatedAs published: “5,789,000”[1]
16.94 per thousand US residents (2025 Census estimate)
Shelters and foster-based rescues. A model estimate for all 13,471 known organisations, built from data reported by over 6,000 organizations. Community intake leaves out transfers between organisations. “Euthanised” is shelter euthanasia only; deaths in care are counted separately.
Best Friends
4,740,000
EstimatedAs published: “4.74 million”[2]
13.87 per thousand US residents (2025 Census estimate)
Brick-and-mortar shelters only, not foster-based rescues. “Killed” is non-live outcomes minus a tenth of live intake, which Best Friends treats as humane euthanasia, so it is not a euthanasia count. Save rate is live intake minus non-live outcomes, divided by live intake.
ASPCA
5,800,000
EstimatedAs published: “5.8 million”[3]
16.97 per thousand US residents (2025 Census estimate)
Restates Shelter Animals Count’s national estimates, so it agrees with SAC by design rather than confirming it.
Charts
The data in charts
Every chart can be downloaded as a PNG or as the CSV behind it, and embedded with a credit link.
Adoption and non-live outcome rates, 2016–2025
Total intake includes transfers in. All years come from the same Shelter Animals Count model release, so they can be compared; counts from older SAC reports cannot. Shaded: 2020, which SAC flags as the pandemic year.
Source: Zooming Paws Research analysis of Shelter Animals Count data (2016–2025).
Three publishers, three definitions: US shelter figures for 2025
Not like-for-like. Shelter Animals Count’s figures are model estimates for shelters and foster-based rescues. The ASPCA republishes them, so those two agree by design and the ASPCA is not an independent confirmation. Best Friends counts brick-and-mortar shelters only, and its “killed” figure is non-live outcomes minus a tenth of live intake, so it is not a euthanasia count.
Source: Zooming Paws Research analysis of Shelter Animals Count, Best Friends Animal Society and ASPCA data (2025).
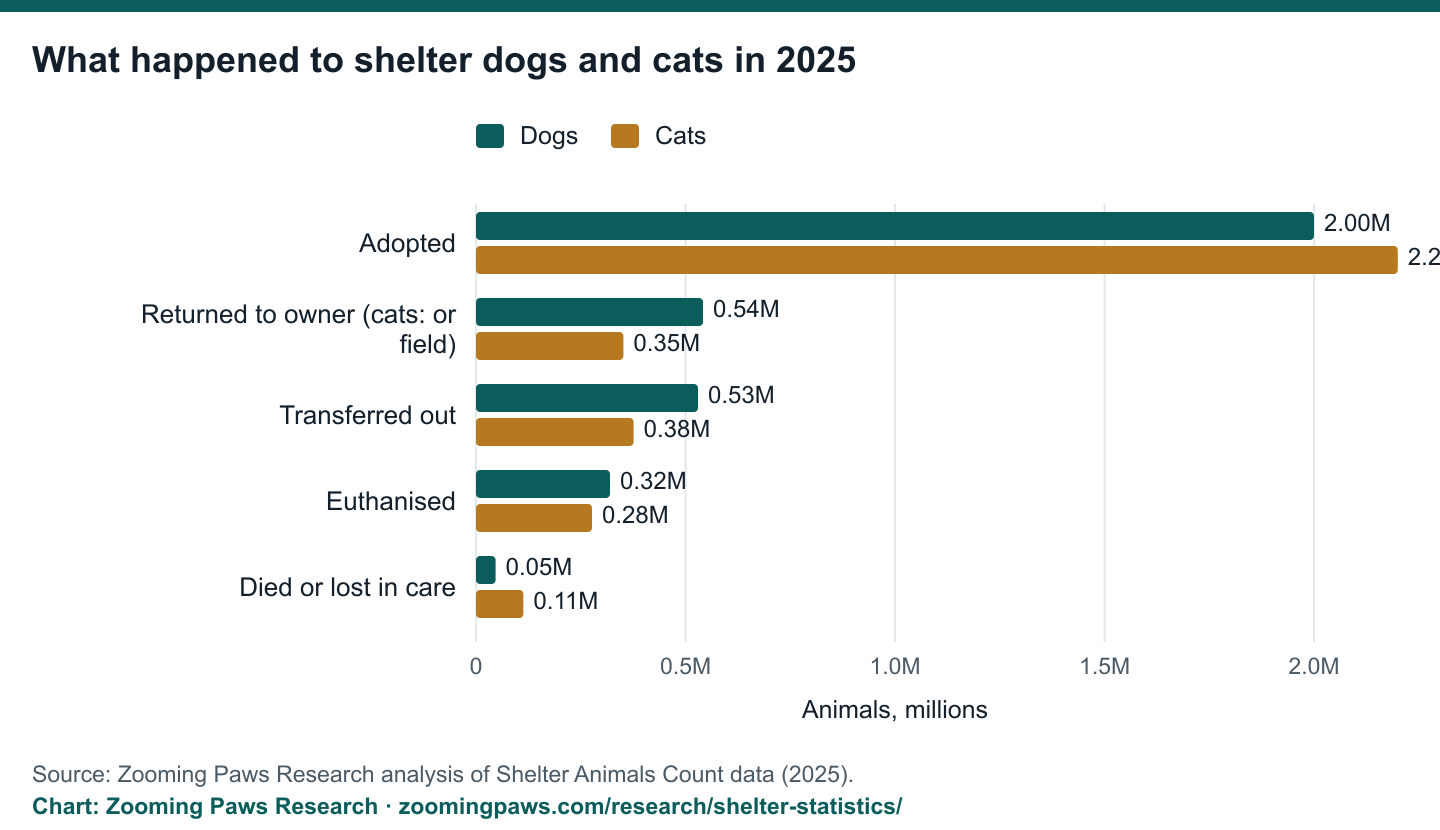
What happened to shelter dogs and cats in 2025
Figures are rounded as Shelter Animals Count publishes them in its Stats at a Glance tables. Returned to field applies to community cats.
Source: Zooming Paws Research analysis of Shelter Animals Count data (2025).
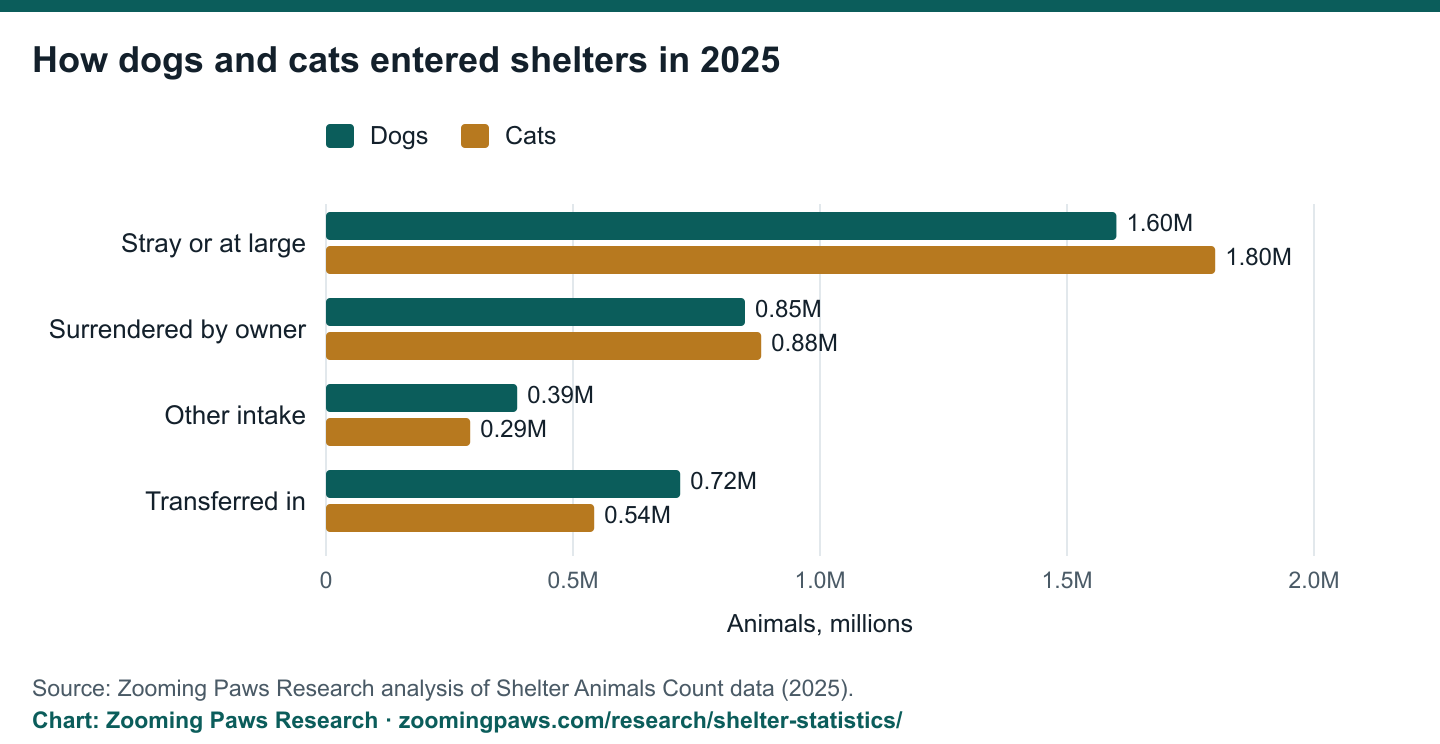
How dogs and cats entered shelters in 2025
Rounded as published. Transfers in are animals moved between organisations; community intake excludes them, which is why national totals usually leave them out.
Source: Zooming Paws Research analysis of Shelter Animals Count data (2025).
The national picture
Shelter Animals Count estimates 5.79 million Estimated[1] community intakes of dogs and cats in 2025. Of the animals leaving care, 4.22 million Estimated[1] were adopted, 638,000 Estimated[1] returned to their owners and 906,000 Estimated[1] transferred to another organisation. Non-live outcomes, which include euthanasia and deaths in care, totalled 757,000 Estimated[1].
Relative to the population, that is about 16.9 Estimated[1][4] animals taken in and 1.75 Estimated[1][4] euthanised for every thousand US residents, using the Census Bureau’s 2025 estimate of 341.8 million Counted[4] people.
Dogs vs cats in shelters
Slightly more cats than dogs come in: 2.96 million Estimated[1] cats against 2.83 million Estimated[1] dogs. Cats were adopted at a higher rate, 63.2% Estimated[1] of total intake against 56.6% Estimated[1] for dogs.
More dogs were euthanised (320,000 Estimated[1] against 277,000 Estimated[1] cats), but cats are more likely to die or be lost in care, so the two species’ overall non-live rates are close: 10.4% Estimated[1] for dogs and 11.1% Estimated[1] for cats.
How the numbers are collected, and why national totals are estimates
Shelter Animals Count builds its national figures from the data that 6,000 Counted[1] or more organisations report to it, out of the 13,471 Counted[1] it knows of, and uses a model to estimate the rest.
Each new SAC report re-runs the model for earlier years, so a figure for the same year can change between reports. That is why the trend chart on this page uses rates from a single report, and why we do not join counts from older reports into one line.
Best Friends runs its own collection for brick-and-mortar shelters and fills gaps with its own model. The ASPCA’s shelter statistics page states that its figures come from Shelter Animals Count.
What changed since 2019
Cats have seen the larger improvement. Their non-live outcome rate was 15.8% Estimated[1] of intake in 2019 and 11.1% Estimated[1] in 2025. For dogs the rate rose from 8.0% Estimated[1] to 10.4% Estimated[1] over the same years.
The ASPCA, quoting SAC, gives an overall euthanasia rate of 10% Estimated[3] in 2019 and 8% Estimated[3] in 2025. Best Friends reports a save rate of 71% Estimated[2] in 2016 and 82.5% Estimated[2] in 2025.
Definitions
- Community intake
- Shelter Animals Count: total intakes excluding transfers in, to show actual community activity and avoid double counting. Includes strays, owner surrenders and other intakes such as seizures and animals born in care.
- Live outcome
- Shelter Animals Count: adoption, return to owner, return to field, transfer out and other live outcomes. Its community live outcomes leave transfers out.
- Non-live outcome
- Shelter Animals Count: died in care, lost in care and shelter euthanasia. Best Friends: euthanised, owner-requested euthanasia, died in care and lost in care.
- Owner-requested euthanasia
- Euthanasia an owner asks the shelter to carry out. Best Friends lists it among non-live outcomes, and its “killed” figure then removes an allowance for humane euthanasia. Shelter Animals Count has recorded owner-intended euthanasia as a type of intake.
- Save rate
- Best Friends’ measure: live intake minus non-live outcomes, divided by live intake. It sets no-kill at a save rate of nine in ten.
Data
US shelter statistics by source, 2025
Every national figure on this page, with its publisher, label and the text as published.
| Adoptions | Shelter Animals Count | 4,223,000.0 | animals | 4,223,000 | Estimated |
| Adoptions | ASPCA | 4,200,000.0 | animals | 4.2 million | Estimated |
| Animals entering shelters | Best Friends | 4,740,000.0 | animals | 4.74 million | Estimated |
| Animals entering shelters | ASPCA | 5,800,000.0 | animals | 5.8 million | Estimated |
| Community intake (dogs and cats) | Shelter Animals Count | 5,789,000.0 | animals | 5,789,000 | Estimated |
| Community intake per 1,000 residents | Zooming Paws Research calculation | 16.9 | per 1,000 residents | No data | Estimated |
| Community intake, cats | Shelter Animals Count | 2,963,000.0 | animals | 2,963,000 | Estimated |
| Community intake, dogs | Shelter Animals Count | 2,825,000.0 | animals | 2,825,000 | Estimated |
| Community live outcomes | Shelter Animals Count | 5,294,000.0 | animals | 5,294,000 | Estimated |
| Euthanasia per 1,000 residents | Zooming Paws Research calculation | 1.8 | per 1,000 residents | No data | Estimated |
| Euthanasia, cats | Shelter Animals Count | 277,000.0 | animals | 277K | Estimated |
| Euthanasia, dogs | Shelter Animals Count | 320,000.0 | animals | 320K | Estimated |
| Euthanasia, dogs and cats | Zooming Paws Research calculation | 597,000.0 | animals | No data | Estimated |
| Euthanised | ASPCA | 597,000.0 | animals | 597,000 | Estimated |
| Killed (Best Friends definition) | Best Friends | 396,000.0 | animals | 396,000 | Estimated |
| Killed, cats | Best Friends | 187,000.0 | animals | 187,000 | Estimated |
| Killed, dogs | Best Friends | 209,000.0 | animals | 209,000 | Estimated |
| Known sheltering organisations | Shelter Animals Count | 13,471.0 | organizations | 13,471 | Counted |
| Non-live outcomes | Shelter Animals Count | 757,000.0 | animals | 757,000 | Estimated |
| Returned to owner | Shelter Animals Count | 638,000.0 | animals | 638,000 | Estimated |
| Save rate | Best Friends | 82.5 | percent | 82.5% | Estimated |
| Save rate, cats | Best Friends | 82.9 | percent | 82.9% | Estimated |
| Save rate, dogs | Best Friends | 82.2 | percent | 82.2% | Estimated |
| Transferred in | Shelter Animals Count | 1,260,000.0 | animals | 1,260,000 | Estimated |
| Transferred out | Shelter Animals Count | 906,000.0 | animals | 906,000 | Estimated |
| US resident population | US Census Bureau | 341,784,857.0 | people | 341784857 | Counted |
Select a column heading to sort by it.
Method
How we built this
Data sources
Shelter Animals Count’s annual data report for the latest year, read from the PDF; Best Friends Animal Society’s public data and methodology pages and its annual press release; the ASPCA’s shelter statistics page; and the Census Bureau’s national and state population estimates for the matching year.
Calculations you can reproduce
Rates per thousand residents divide the national count by the Census population estimate for the same year and multiply by a thousand. Total euthanasia adds SAC’s published dog and cat figures. Adoption share divides SAC’s adoptions by its community intake. Every calculation is written out in the CSV notes column.
Exclusions
We use only the latest SAC report for counts, because each report revises earlier years. We do not use Best Friends’ yearly series before the latest year, which is published only as an image.
Downloads: the full table and the CSV under each chart. Our wider method is on how we calculate.
Limits
What this data cannot tell you
- No state figures yet. Shelter Animals Count publishes state data only in an interactive dashboard, and Best Friends only through a data request with a sharing agreement. We could not download either, so there is no state explorer, state map or state ranking on this page. Both can be requested under a data agreement; we will add states if its terms allow publishing them.
- National totals are model estimates. SAC does not publish a margin of error or the share of animals covered by reporting organisations.
- SAC revises earlier years in each report, so counts from different reports are not comparable. Only its rate series is used as a trend.
- Best Friends’ “killed” is not a euthanasia count, and it counts shelters only, not foster-based rescues.
- The ASPCA’s figure for cats returned to owner or field matches SAC’s previous-year number rather than the latest one; we use SAC’s.
- Counts for years before the latest two are published by SAC only as unlabelled bar charts, so we do not show yearly counts.
Press kit
For journalists and bloggers
Copy any line below. Each copied line carries the status, publisher and year of every figure in it, so it stays accurate on its own. Please credit and link this page. Suggested credit line: Source: Zooming Paws Research analysis of Shelter Animals Count, Best Friends and Census data (2025)
- Shelter Animals Count estimates that 5.79 million Estimated[1] dogs and cats entered US shelters and rescues in 2025, excluding transfers between organisations.
- Shelter Animals Count estimates that US shelters and rescues euthanised 320,000 Estimated[1] dogs and 277,000 Estimated[1] cats in 2025.
- Shelter Animals Count estimates that 4.22 million Estimated[1] shelter dogs and cats were adopted in the US in 2025.
- Best Friends Animal Society reports a US shelter save rate of 82.5% Estimated[2] in 2025 under its own definition (live intake minus non-live outcomes, divided by live intake), up from 71% Estimated[2] in 2016.
- US shelters and rescues took in about 16.9 Estimated[1][4] dogs and cats per thousand residents in 2025, a Zooming Paws Research calculation from Shelter Animals Count’s estimate and the Census Bureau population estimate.
Cite this page
Zooming Paws Research. (2026). Shelter dogs and cats by the numbers: intake, adoptions and euthanasia. Zooming Paws. Retrieved October 27, 2026, from https://zoomingpaws.com/research/shelter-statistics/
Downloads
FAQ
Questions people ask
- How many animals enter shelters each year in the US?
- Shelter Animals Count estimates that 5.79 million Estimated[1] dogs and cats entered US shelters and rescues in 2025, not counting transfers between organisations: 2.83 million Estimated[1] dogs and 2.96 million Estimated[1] cats. Best Friends, which counts brick-and-mortar shelters only, puts the figure at 4.74 million Estimated[2].
- How many dogs and cats are euthanized in shelters each year?
- Shelter Animals Count reports 320,000 Estimated[1] dogs and 277,000 Estimated[1] cats euthanised in 2025, 597,000 Estimated[1] in all. Best Friends reports 396,000 Estimated[2] “killed”, but its definition subtracts a tenth of live intake as presumed humane euthanasia, so the two numbers measure different things.
- How many shelter animals are adopted each year?
- About 4.22 million Estimated[1] dogs and cats were adopted from US shelters and rescues in 2025, according to Shelter Animals Count: roughly 2.0 million Estimated[1] dogs and 2.2 million Estimated[1] cats. That is about 73% Estimated[1] of community intake, our calculation from SAC’s totals.
- Are more dogs or cats euthanized in shelters?
- More dogs were euthanised in 2025: 320,000 Estimated[1] dogs against 277,000 Estimated[1] cats, per Shelter Animals Count. Cats are more likely to die or be lost in care, so their total non-live outcome rate was 11.1% Estimated[1] of intake against 10.4% Estimated[1] for dogs.
- Is shelter euthanasia going down?
- For cats, yes: the non-live outcome rate fell from 21.0% Estimated[1] of intake in 2016 to 11.1% Estimated[1] in 2025. For dogs it was 8.0% Estimated[1] in 2019 and 10.4% Estimated[1] in 2025. Dog euthanasia fell 6.8% Estimated[1] between 2024 and 2025 in SAC’s latest figures.
- What is a no-kill shelter?
- Best Friends defines a no-kill shelter as one with a save rate of nine in ten animals or more. Its national save rate for 2025 was 82.5% Estimated[2], up from 71% Estimated[2] in 2016, and it says 68% Estimated[2] of shelters met the benchmark.
- Why do shelter statistics from different organizations differ?
- They cover different organisations and define outcomes differently. Shelter Animals Count models all 13,471 Counted[1] known shelters and rescues; Best Friends counts brick-and-mortar shelters only and defines “killed” its own way. The ASPCA republishes SAC’s figures, so it agrees with SAC by design.
- How many animal shelters are there in the US?
- Shelter Animals Count lists 13,471 Counted[1] known animal welfare organisations for 2025: 4,100 Counted[1] shelters and 9,371 Counted[1] rescues. It builds its national estimates from data reported by 6,000 Counted[1] or more of them, so national totals are modelled, not a full count.
- Which state has the most shelter animals?
- We do not publish a state ranking yet. Shelter Animals Count and Best Friends hold state data, but neither releases it in a form we could download without a data agreement. Nationally, shelters took in about 16.9 Estimated[1][4] dogs and cats for every thousand residents in 2025.
Keep going
Related calculators and research
Sources
Sources
[1] 2025 Annual Data Report; 2024 Annual Analysis; 2023 Annual Analysis; Animal Sheltering Statistics 2019
Shelter Animals Count (a program of the ASPCA) · retrieved October 27, 2026 · next review February 4, 2027
Terms: ASPCA Terms of Use (Dec 2025): "You must not copy, download, reproduce, republish ... any of the material on the Website for any purpose without the ASPCA's express written permission"; robots/spiders prohibited. Cite figures as facts with attribution; do not republish reports or charts.
https://www.shelteranimalscount.org/2025-report[2] Pet data / Animal shelter statistics (Pet Lifesaving Dashboard), 2025 national dataset
Best Friends Animal Society · retrieved October 27, 2026 · next review April 15, 2027
Terms: Pet data page: "Please feel free to quote any of the following statistics directly and to cite Best Friends Animal Society". Site terms otherwise prohibit reproduction without written permission; shelter/state-level data only through the data-request form under a Data Sharing Agreement.
https://bestfriends.org/saving-shelter-animals/pet-data[3] U.S. Animal Shelter Statistics
ASPCA · retrieved October 27, 2026 · next review February 4, 2027
Terms: ASPCA Terms of Use: "You must not copy, download, reproduce, republish ... any of the material on the Website for any purpose without the ASPCA's express written permission". Cite figures as facts with attribution.
https://www.aspca.org/helping-shelters-people-pets/us-animal-shelter-statistics[4] State Population Totals, NST-EST2020 through NST-EST2025 alldata files
U.S. Census Bureau, Population Estimates Program · retrieved October 27, 2026 · next review December 31, 2026
Terms: No licence text in the files; Census citation guidance: "Data users who create their own estimates using data from disseminated tables and other data should cite the Census Bureau as the source of the original data only."
https://www2.census.gov/programs-surveys/popest/datasets/2020-2025/state/totals/NST-EST2025-ALLDATA.csv
Figures are compiled from the named sources for information. Definitions vary by publisher, so check a source’s own definitions before comparing its figures with another’s. Not for legal or regulatory use. Attribution: Zooming Paws Research.